Before Neural Networks: Linear Regression on Property Prices
A dive into basic linear regression before Neural Networks.

We will assess if it's possible to buy an apartment on a $185,000 budget.
Data Set
We will analyze 3 month property price data for Centrium Towers in Dubai from Nov, Dec and Jan 2017.
Hypothesis
What is the max apartment size I can buy with a USD 185,000 budget?
Cleaning the data
I used Google Sheets to process and clean the data. Some outliers needed to be removed.
Raw data has several columns we don't need. Only Total Price (in USD) and Size in Sq. ft. are of interest. The same values will be our training set.
Area (sq-ft)    Total Price (USD)
969.28          231,608
722.58          159,474
977.57          226,158
977.57          135,695

... and so on totaling 57 values.
n = 57 values
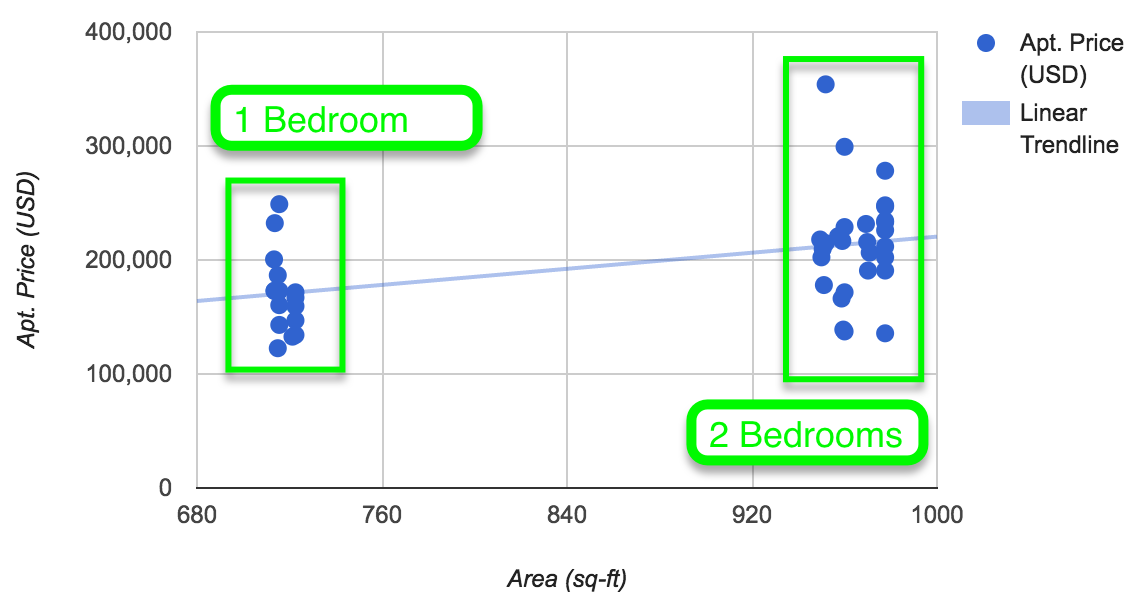
We know that the Centrium high-rise apartment complexes have two unit types:
1 bedroom
2 bedrooms
We could check online for the average sizes of these units but let's try to figure that out from our data.
Analysis Bedroom Size
We create a scatter plot of unit size vs total price. Visually we start to observe a pattern in sizes, all the way from one bedroom to penhouses.
Getting rid of penthouses
In this problem we are comfortable with removing outliers. Outliers in our case may be penthouses or after market sales at crazy prices.
We can visually filter outliers in this case. We cannot use ±2 Standard Deviation because this isn't normally distributed data.
Below is a histogram of apartment sizes. I am not interested in apartments above 1,200 sq. ft.

New scatterplot without penthouses or weird prices

Perfect. Now we are talking. Updated n = 44.
Linear Regression
To know if USD 185,000 is enough to invest is some kind of size we build a linear regression model.
Linear regression is an approach for modeling the relationship between a dependent variable y and one or more explanatory variables. In our case:
- The dependent variable is total price
- The explanatory variable is apartment size
Linear regression formula on an x/y plane is
y = a + xb

y is the output (total price)
x is the input (apt. size)
We know y, i.e. USD 185,000 and to find x, the apartment size we need our two parameters, a and b :)
In Google Sheets, we can get the linear regression formula with a single option.
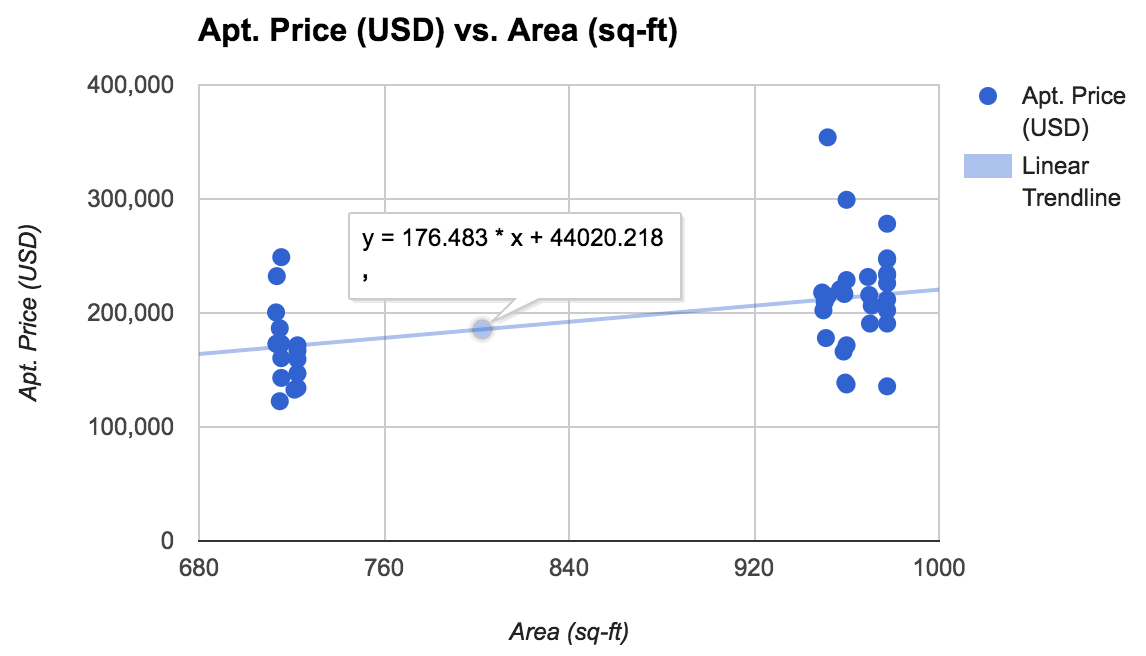
We have the formula thanks to Google Sheet:
y = 44,020 + 176.48 * x


From the looks of this, purchasing a 0 size house will cost us at least USD 44,020. Think of this as an entry price.

The second term tells us that we have to pay 176.48 for every increase in 1 square foot of the apartment.
What size for 185k?
Let's plug in our budget of USD 185,000
185,000 = 44,020 + 176.48 * x

=> 185,000 - 44,020 =  176.48 * x
=> 140,980 = 176.48 * x
=> x = 140,980/176.48 = 798.84
Maximum size apartment we can purchase: 798.84 sq. ft. for our selected building
Now we know 1 bedroom apartment is affordable through our USD 185,000 budget.
There's a catch
Notice there are many 2 bedroom apartments that are below USD 185,000!
To sort this out we would need to look at each cluster and figure out prices that are outliers.
To fix this we include total prices:
mean - 1 SD <= prices <= mean + 1 SD

This will remove price area combinations that are outside the above range.
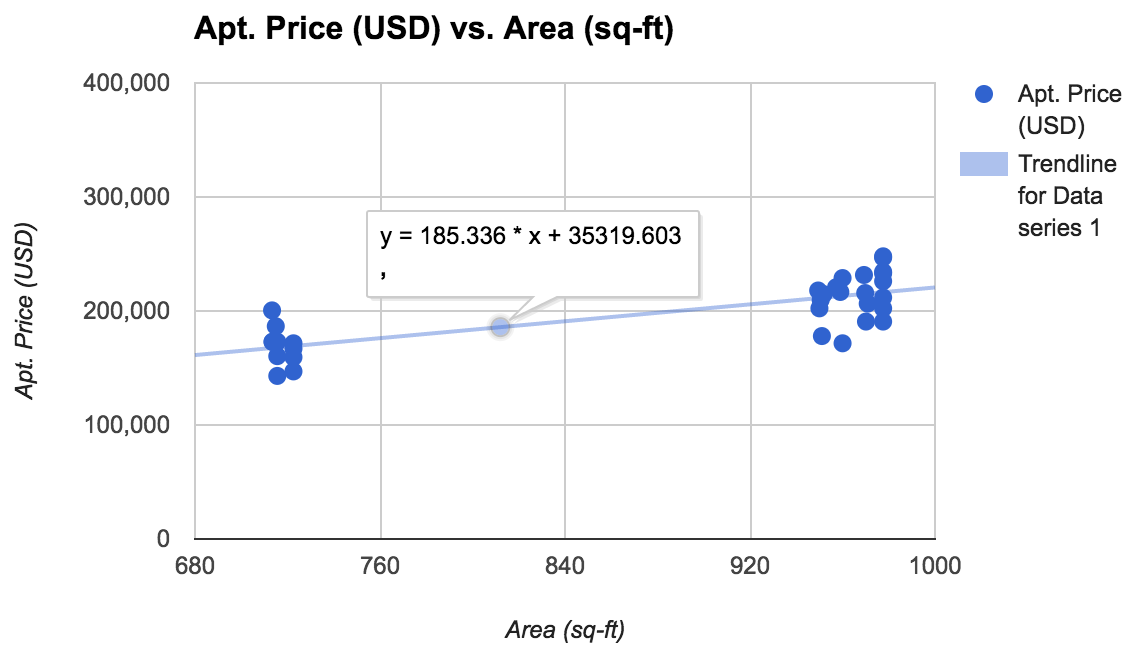
The cluster chart now looks like this for N = 37
From the data, average one bedroom size: 717.5 sq. ft.
and average two bedroom size: 966 sq. ft
We have the formula thanks to Google Sheets as usual:
y = 35,319 + 185.34 * x


From the looks of this, purchasing a 0 size house will cost us at least USD 35,319.

The second term tells us that we have to pay 185.34 for every increase in 1 square foot of the apartment.

185,000 = 35,319 + 185.34 * x
=> 185,000 - 35,319 =  185.34 * x
=> 149,681 = 185.34 * x
=> x = 149,681/185.34 = 807.6
Maximum size apartment we can purchase: 807.6 sq. ft. in the Centrium Towers.
Hmm, just as before we can only purchase a one bedroom apartment with USD 185,000.
Conclusion
Purchasing a one bedroom 717.5 sq. ft. apartment at these towers will cost approximately:
y USD = 35,319 + 185.34 * x sq. ft
i.e. y USD = 35,319 + 185.34 * 717.5
=> 717.5 sq. ft home should cost about USD 168,300.

We save USD 16,700 (or not in case we have auxiliary payments ;)
I recently completed the Introduction To Inferential Statistics course and started with Andrew Ng's Stanford course.
Data Set
We select 3 month (Nov-Dec-Jan 2017) property price data for Centrium Towers in Dubai.